- Download
- Welcome to SOFiA
- Who is behind SOFiA
- Feature overview
- System overview
- Function reference
- readVSAdata
- mergeArrayData
- F/D/T
- gauss
- lebedev
- S/W/G
- S/T/C
- W/G/C
- S/F/E
- M/F
- R/F/I
- P/D/C
- I/T/C
- makeMTX
- makeIR
- visual3D
- Coordinate System
- Application Examples
- Example 1
- Example 2
- Example 3
- Example 4
- Example 5
- Example 6
- Example 7
- Example 8
- Array Datasets
- VariSphear system
- Groups and Mailinglists
- Contact and Support
- How to Reference
|
SOFiA Array Response Visualization
SOFiA visual3D is made to visualize array responses. It needs a data matrix generated by makeMTX. Different visual styles are available.

ARGUMENTS
Input
| Name |
Type |
Purpose |
Default |
| Y |
int |
Frequency domain data from P/D/C or
I/T/C |
- |
| win |
float |
Window IR tail [0-1] with a HANN window |
1/8 |
| resampleFactor |
float mtx |
Resampling factor |
1 |
Output Void - function directly plots to the current figure
VISUAL STYLES
| visualStyle |
Type |
Detail |
| 0 |
Globe |
surface colors indicate the intensity |
| 1 |
Flat |
surface colors indicate the intensity |
| 2 |
3D Pattern |
extension indicate the intensity |
| 3 |
3D Pattern |
extension indicate the intensity |
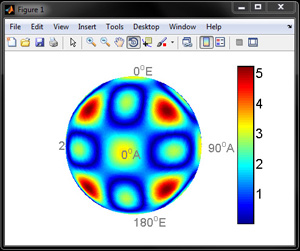
The following figures show the example dataset from sofia_exampleMtxData.mat plotted with different visual styles.
visualStyle = 0
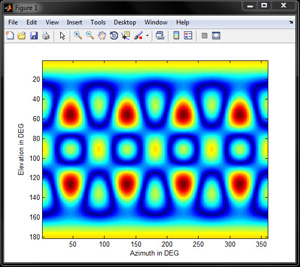
visualStyle = 1
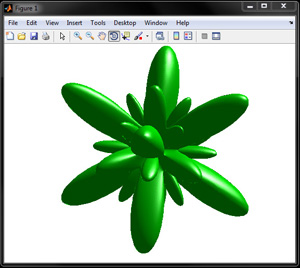
visualStyle = 2
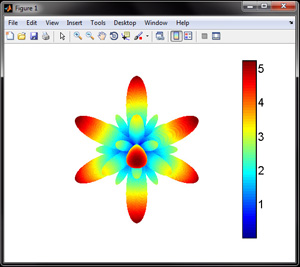
visualStyle = 3
FILE(S):
| File |
Type |
OS/Matlab |
| sofia_visual3D.m |
Help header, Function |
All OS |
HEADER
/*
void = sofia_visual3d( mtxData, visualStyle, [colormap])
------------------------------------------------------------------------------------
|
void |
|
------------------------------------------------------------------------------------ |
mtxData |
SOFiA 3D-matrix-data [1° steps] |
visualStyle |
0 - Globe, surface colors indicate the intensity
1 - Flat, surface colors indicate the intensity
2 - 3D pattern, extension indicates the intensity
3 - 3D pattern, extension+colors indicate the intensity |
color_map |
MATLAB colormaps (see Matlab reference) [optional] |
*/ |
|
|

